A Government Economist Analyzes Economic IndicesJapan Ranks First in the World in “Per Capita Stock”: Japan’s Strengths and Weaknesses as Indicated by Its “Inclusive Wealth”
Gross domestic product (GDP) is one of the indices that measure a nation’s wealth. As is widely known, Japan’s GDP came in third today, overtaken by China. Japan is no longer in the top tier worldwide in terms of GDP per capita.
Meanwhile, in contrast to what is indicated by those economic indices that measure the flow of goods and services like GDP, if you observe “inclusive wealth,” a stock index announced by the United Nations last year, Japan ranks second after the United States, and has the largest amount per capita.
Nibayashi Ken, Counselor for Trade and Investment, Office for Promotion of Regulatory Reform, Cabinet Office
This paper will discuss Japan’s strengths and weaknesses while reviewing recent GDP trends, followed by an explanation of the Inclusive Wealth Index.
Japan’s GDP is on a downtrend, both on a gross and a per capita basis
In this section we look at an international comparative analysis of GDP in the World Economic Outlook Database April 2013 (hereinafter referred to as “WEO”) published by the International Monetary Fund (IMF). There are two ways to compare GDP among countries: using nominal foreign exchange rates, and using purchasing power parity (or PPP). PPP is calculated based on an assumption that exchange rates between currencies should equal the ratio of each country’s purchasing power, and it is believed to indicate a country’s income levels in real terms.
First, let us review GDP based on nominal exchange rates. Japan had long ranked second after the United States in terms of GDP, but in 2008 was overtaken by China, which had steadily climbed up the ranks from the fifteenth position it held in 1981. The WEO projects that China’s GDP will grow to $14.9 trillion in 2018, whereas that of Japan is projected to be merely $5.9 trillion.
The graph below shows the trends in GDP share based on PPP,. In terms of PPP-based GDP, China ranked higher than Japan in 2002, and is expected to even surpass the United States (which has a 17.7% share) to become the world’s largest economy (with a 19.0% share) in 2018. Furthermore, India surpassed Japan in 2012 to rank third, and India’s share is expected to grow to 6.5% in 2018, well over Japan’s 4.7%. In other words, in 2018 the scale of the Japanese economy is expected to be only 25% of China’s and 70% of India’s.

It should be noted that it is only natural that China and India would both surpass Japan in terms of gross GDP because of their large populations: China’s population is ten times larger than Japan’s and India’s is nine times larger. That being the case, a per capita GDP analysis may give us a better perspective on Japan’s position in the international community in terms of GDP.
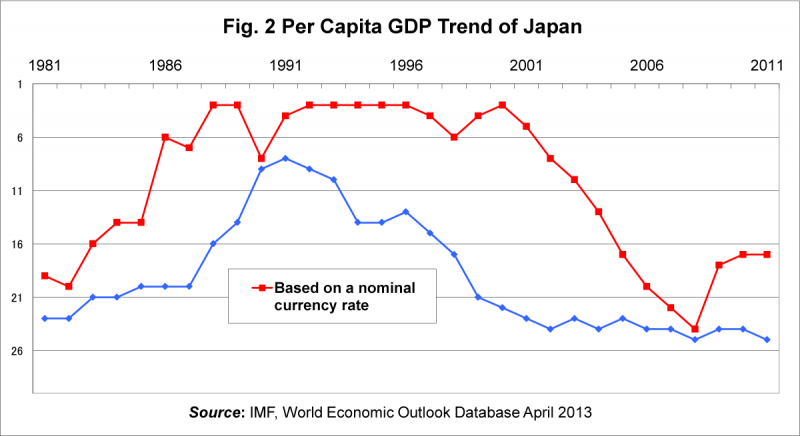
First, looking at trends in GDP share as calculated using nominal currency exchange rates, from the mid-1980s through early 2000 Japan ranked fifth to tenth, but afterwards its position has been in a downward trend and in 2011 its position fell to seventeenth. If evaluated in terms of PPP-based GDP, Japan ranks even lower: it was in eighth place in 1991, a record high for the country, but is currently in twenty-fourth place.
Asia to become a major purchasing power among geographic regions
As discussed above, Japan is experiencing poor GDP performance. However, there are some positive indicators; for example, Japan could survive by seeking business opportunities that stem from strong domestic demand in Asian countries or regions including China, Singapore, Taiwan, and others.
With these aspects in mind, let us review Asia’s international GDP status, excluding Japan (based on PPP).
| 1981 | 1991 | 2001 | 2011 | 2018 (Est.) |
|
|---|---|---|---|---|---|
| Developed nations | 64% | 62% | 56% | 44% | 39% |
| Asia | 13% | 19% | 23% | 33% | 40% |
| Others | 23% | 19% | 21% | 22% | 21% |
*1 “Developed nations” means “Advanced economies” as referred to by the WEO. “Asia” is basically represented by “Developing Asia” and “ASEAN-5.” Korea, Singapore, and Taiwan, referred to as “Advanced economies” in the WEO, are included in “Asia.” Japan is excluded from “Advanced economies.”
Source: IMF, World Economic Outlook Database April 2013
In the above table, we can see that Asia’s share, which accounted for only 13% in 1981, increased to 33% in 2011. “Asia” is expected to surpass “Developed nations” in GDP share in 2018. It is therefore important for Japan to tie the aforementioned growth in Asia to its future growth.
Japan’s strength as measured by “inclusive wealth”
So far, it has been confirmed that Japan has faced a decrease in economic power as measured by GDP. However, The Economist magazine in the United Kingdom published a sensational article to the effect that “Japan is the wealthiest nation based on its stock assets, as indicated in the United Nations’ report.” The Economist article was referring to the “Inclusive Wealth Report 2012,” compiled last year by the UnitedNationsUniversity (UNU) in collaboration with the United Nations Environment Programme (UNEP). This report was first announced during the United Nations Conference on Sustainable Development (Rio+20) held in Brazil in June of last year, and is scheduled to be released every two years.
The report’s subtitle is “Measuring Progress Toward Sustainability.” As this subtitle implies, “inclusive wealth” is intended to gauge the magnitude of a productive economic base from the viewpoint of sustainability. To be more specific, this report measures and analyzes not only manufactured capital (e.g., roads, buildings, machineries), but also human capital (labor, educational attainment) and natural capital (forests, crude oil, mineral resources) for the twenty countries that were studied. (*2)
(*2) While the report also recommends that social capital (networks, trust) be estimated, it does not estimate social capital value due to lack of data, saying that it will be covered in the next report.
First, inclusive wealth (gross) is illustrated in the following table:
| US | Japan | China | Germany | UK | |
|---|---|---|---|---|---|
| Inclusive Wealth (in 2008) |
117.8 | 55.1 | 20.0 | 19.5 | 13.4 |
| Growth rate(annualized) (1990–2008) |
(0.7%) | (0.9%) | (2.1%) | (1.8%) | (0.9%) |
| Manufactured Capital | 22.3 | 15.0 | 6.2 | 4.9 | 1.5 |
| Human Capital | 88.9 | 39.5 | 8.7 | 13.4 | 11.8 |
| Natural Capital | 6.6 | 0.6 | 5.1 | 1.2 | 0.1 |
Next, per capita inclusive wealth on the same basis is indicated below:
| Japan | US | Canada | Norway | Australia | (Ref.) China |
|
|---|---|---|---|---|---|---|
| Inclusive Wealth (in 2008) |
435,466 | 386,351 | 331,919 | 327,621 | 283,810 | 15,027 |
| Growth rate (annualized) (1990–2008) |
(0.8%) | (0.7%) | (0.4%) | (0.6%) | (0.1%) | (2.1%) |
| Manufactured Capital | 118,193 | 73,243 | 56,520 | 90,274 | 66,970 | 4,637 |
| Human Capital | 312,394 | 291,397 | 171,960 | 201,361 | 132,376 | 6,571 |
| Natural Capital | 4,879 | 21,711 | 103,439 | 35,986 | 84,463 | 3,819 |
There are two distinguishing features in the above tables. First, while Japan ranks low with respect to GDP, it comes in second after the United States in terms of inclusive wealth, and in terms of inclusive wealth per capita Japan is the highest in the world. Second, Japan has more human capital and manufactured capital than any other country, while its natural capital is quite limited.
So the question is, why does Japan have such high human and manufactured capital? The report doesn’t provide original data or a detailed estimation methodology, but let us analyze underlying factors while referring to the literature quoted in the report (*3).
(*3) The estimation formula used in the report will be explored in the addendum that follows.
Human capital is estimated using the following calculations:
(a) Human capital per individual is calculated based on educational attainment.
(b) Size of population aged fifteen or over is calculated using demographic statistics.
(c) The monetary value or the shadow price of human capital is calculated based on labor compensation, mortality rates, and working period.
(d) Monetary value of human capital: (a) x (b) x (c)
In the original data provided in the report, Japan ranks thirteenth (*4) when it comes to educational attainment (represented by “a”). Population aged fifteen or over (“b”) comes in seventh (*5). However, in the former category (i.e., educational attainment), most of the top countries are small ones like Norway, and in the latter category (i.e., population aged fifteen or over), developing countries like China and India come to the top. Only the United States and Japan are in the top tier in both categories.
For Japan, the monetary value of human capital (“c”) is well over that for the United States, according to informed sources of the United Nations. These are the reasons why the United States and Japan outshine others in terms of human capital.
It should be noted though that item (b) above takes into account the total population aged fifteen or over. Because there is no distinction between the population in the labor force (employed and unemployed) and the population not in the labor force, unemployed senior citizens are also counted in this group. As its population is rapidly aging, Japan’s human capital base may have been overestimated.
(*4) Based on the data used in the report compiled by Professor Barro of HarvardUniversity and others.
(*5) Based on data released by the United Nations.
Per capita human capital is derived by dividing the total amount of human capital by the total population, which includes the population under fifteen. The falling birthrate makes the denominator relatively smaller, which could have pushed up the per capita number even higher than that for the United States.
Regarding manufactured capital, the calculations are based on the Perpetual Inventory Method, where the initial capital (in 1970) is estimated based on a certain assumption (see the addendum). The monetary value of inclusive wealth stock is calculated using the gross fixed capital formation as in the National Accounting and the depreciation rate. When this calculation method is used, the greater the investment, the higher the wealth value. Looking at the original data, Japan’s investment amount is currently half that of the United States, but in the 1990s it was higher than the United States. This explains Japan’s high manufactured capital rank.
The fact that Japan’s “inclusive wealth” is at the top has a very profound meaning in the sense that it embodies the general perception shared among the Japanese people that “Japan is one of the richest countries, blessed with a high level of education, labor, and facilities investment.”
Whether Japan can maintain this strength in the future is another issue. With respect to human capital, Japan’s population is expected to further decline in the future. Therefore, it is important for Japan to maintain its human capital by further improving the quality of education, such as improving the college-going rate, and raising income levels for workers.
With respect to manufactured capital, Japan’s investment amount is currently only around 65% of its peak level (half that of the United States), so unless domestic investment increases in the future, Japan may not be able to maintain its lead. The Japan Revitalization Strategy aims to strengthen Japan’s human resource power and revitalize private-sector investment, and it is vital that concrete effective measures are taken.
Conclusion and implications for future policymaking
The above discussions can be summarized as follows:
・ Japan is on a downtrend in terms of GDP, both on a gross and a per capita basis.
・ On the other hand, Asian countries are on an uptrend with respect to GDP share. Japan could take advantage of Asian growth and use it to grow its economy.
・ In contrast with the results derived from the flow analysis provided by GDP, Japan comes in second if analyzed using indices on the stock. In per capita inclusive wealth, Japan ranks top in the world. Japan is blessed with abundant human capital and manufactured capital. That said, improving education and increasing investment are vital to maintain this position.
The crucial point is how we can achieve returns in the form of income from the country’s strength with respect to its abundant human capital and manufactured capital. My personal suggestions are as follows:
First of all, a significant improvement in productivity must be realized. Japan’s productivity is low, especially in the service sector which currently accounts for around 70% of the country’s GDP, and its abundant stock wealth is not tied to economic growth. We really need to stick to the target of achieving a “strong economy where labor productivity grows by more than 2%,” as stipulated in the Japan Revitalization Strategy.
Secondly, we must strive to build a society where various people including women and senior citizens have the opportunity to use their skills and experience to play active roles. As mentioned above, estimating human capital, as in “inclusive wealth,” is based on the number of human resources. If these human resources aren’t fully utilized, precious assets will not be tied to the country’s growth.
Lastly, the government must adopt measures to tie the country’s growth to increased income for its population. The Japan Revitalization Strategy points out that the country must “include the fruits of economic growth in people’s lives.” Going forward, Japan must adopt specific measures to realize the above based on these perspectives.
Addendum: Estimation models for each type of capital
Inclusive wealth can be derived from the following equation, which represents the sum of human capital stock, manufactured capital stock, and natural capital stock being individually estimated first and then revaluated by applying shadow prices:
![]()
Human Capital
Human capital per employer is defined as a function of educational achievement and interest rates under the assumption that educational investment will produce returns equal to the interest rate.
![]()
h: human capital per employer ρ: rate of interest (constant at 8.5%) A: educational attainment (years of education)
Human capital (as denoted by “H”) can be derived by multiplying the human capital per employer by the number of people aged 15 or over:
![]()
P: population aged 15 or over
Meanwhile, the shadow price for human capital is derived from the following equation, which represents the aggregate income that an employer could earn for the rest of his/her life:
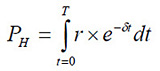
r: income earned per employee δ: discount rate (constant at 8.5%) T: years of employment in life
“T”, which denotes years of employment, is determined by a demography related to age and sex (e.g., population size, death rate) as well as labor market indices (including the labor force participation ratio).
Manufactured Capital
For manufactured capital, calculations are based on the Perpetual Inventory Method, where steady-state estimates are used, assuming that the capital-output ratio of the economy was constant in 1970, when the initial capital estimate was fixed:
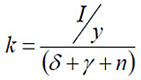
k: capital-output ratio I: investment y: GDP δ: depreciation rate (constant at 7%) γ: weighted average growth rate for the countries analyzed and the world at the time of steady-state estimates n: population growth rate
Subsequently, by multiplying this by the GDP of the economy being studied, an initial capital estimate can be obtained:
In order to minimize any errors from the departure point, the report assumes that as capital depreciates over time, the initial capital estimate retained in 1990 would be about 22%, and would be only 5% in 2008.
Note: The comments contained herein are solely based on the author’s opinions, and do not reflect in any way the opinions of the Cabinet Office.
Translated from “Nihon wa ‘Hitoriatari Sutokku’ dewa Sekaiichi – ‘Hokatsuteki Tomi’ de miru Nihon no Tsuyomi to Kadai(Japan Ranks First in the World in “Per Capita Stock”: Japan’s Strengths and Weaknesses as Indicated by Its “Inclusive Wealth,” Nikkei Business Online, August 6, 2013. (Courtesy of Nikkei Business Publications, Inc.)
Related posts:
 The Opportunity and Risk of “Abenomics” That Has Begun to Push the Japanese Economy Out of Stagnation and Deflation
 Abenomics and Takahashi Policy — Aiming to revitalize the Japanese economy
Manufacturers Are Avoiding Price Competition and Achieving Growth by Creating Value
Abenomics and Takahashi Policy — Aiming to revitalize the Japanese economy
Manufacturers Are Avoiding Price Competition and Achieving Growth by Creating Value
 Wearable Devices Are On Their Way — What will be the fate of Japanese electronic parts?
 Global Companies from Japan