Widening Income Inequality During COVID-19: Differing Impact Across Income Brackets
Urakawa Kunio, Professor, Faculty of Economics of Kyushu University
Key points
- Average yearly income trending downward in the bottom 40% income bracket
- Income redistribution limited by current tax and social security systems
- Lack of safety net for types of employment with a high risk of instability

Prof. Urakawa Kunio
COVID-19 has had a major impact on the world economy. Japan’s economy has been greatly impacted, with GDP for FY2020 down 4.4% from the previous year. This is larger than the decline of 3.6% in 2008 when the Lehman Brothers collapse occurred.
The Quarterly Estimates of GDP for Jul.–Sept. 2021 released on November 15, 2021, showed negative growth of -0.8% compared to the preceding term, the first negative growth in two quarters. Full economic recovery will likely take more time.
The economic impact of COVID-19 has been felt most keenly in the service industry sector, including air transportation, postal services, railroads, lodging, restaurants, entertainment, and other lifestyle-related services. Workers employed in unstable employment types in vulnerable industry sectors are at high risk of a drop in income, unemployment, or business closure, which will impact the lives of their spouses, children, and other family members.
The question arises as to what changes can be observed in economic variables such as household income, expenditure, and assets prior to and after COVID-19. Based on the aggregate data in the Family Income and Expenditure Survey by the Statistics Bureau, Ministry of Internal Affairs and Communications (MIC) for 2019 and 2020, I examined changes in household income, expenditure, and assets by income bracket, and estimated the status of inter-household inequality.
The top rows of the table show yearly income by quintile rank for all households in 2019 and 2020, and the Gini Coefficient (the income disparity index, with zero representing equality and values closer to one representing greater inequality) as estimated by the author. Average yearly income increased slightly from 5.14 million yen in 2019 to 5.16 million yen in 2020.
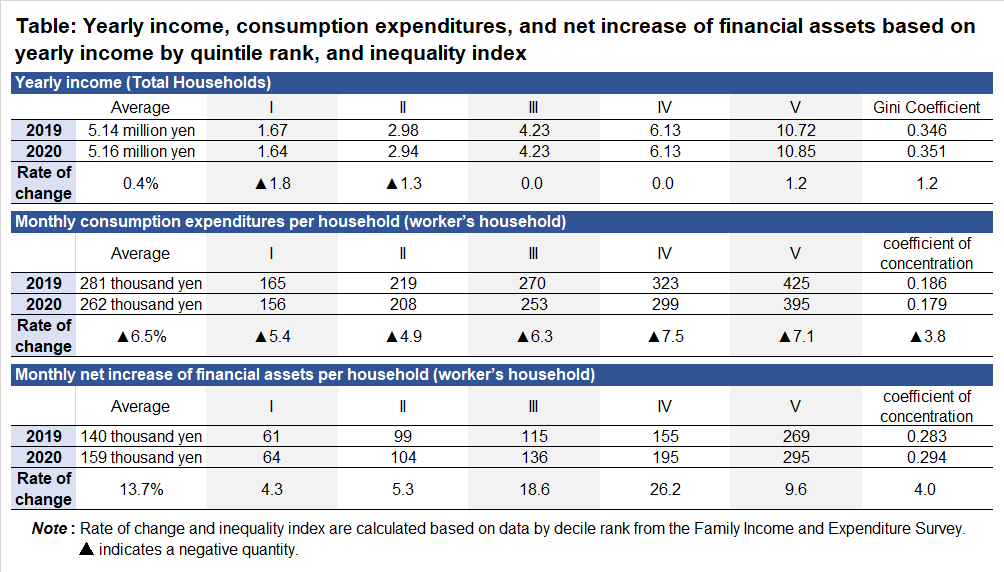
However, for yearly income in quintiles I and II, which is the bottom 40% income bracket, average yearly income is on a slight downward trend. The slight increase in average income overall is due to the effect of an increase in average yearly income of more than 1% in the higher income quintile V. In other words, it is primarily the low- and middle-income groups that saw their yearly incomes fall during the COVID-19 period (2020). The Gini Coefficient increased slightly from 0.346 to 0.351.
The household survey shows the average yearly income for households where the head of household is a laborer, by yearly income bracket by category, such as (1) real income (current income + special income); (2) current income (wage income + income from business or second job + income from agriculture, forestry, and fisheries + property revenue + regular social security benefits + remittance, etc.); (3) wage income; and (4) special income.
I investigated the change in worker’s household income from 2019 to 2020 based on yearly income bracket, and the change in the coefficient of concentration as estimated by the author. The coefficient of concentration is indicated by a value of minus 1-1, which means the larger the value the more concentrated the variable in the higher income bracket. In the case of (1) real income, (2) current income, and (3) wage income, the rate of increase in income in the middle- and high-income brackets was higher than in the low-income bracket. The result was an increase in the coefficient of concentration of 2.1%, 3.0%, and 2.4% respectively.
On the other hand, (4) special income mitigated to some extent the impact of widening income inequality. In 2020, this item includes a special fixed-sum cash benefit (100,000 yen), which was provided as an emergency measure in response to the COVID-19 pandemic. This temporary public benefit contributed to a slight reduction in the rise in real income inequality.
However, according to the author’s tentative calculation using data compiled by the Family Income and Expenditure Survey, the co-efficient of concentration of disposable income, which subtracts tax (direct tax) and social insurance premiums from real income, still increased by 2.0% from 2019 to 2020. In terms of worker’s household, there was limited evidence of redistribution of income to alleviate the impositions of the COVID-19 pandemic.
This result contrasts with the study by Professor Andrew Clark and his colleagues from the Paris School of Economics investigating changes in income inequality (adjusted for the number of household members) in France, Germany, Italy, and Spain in 2019 prior to COVID-19 and after the spread of the pandemic in 2020. In all four countries, the Gini Coefficient of disposable income dropped after COVID-19. Factors that contributed to reducing inequality include the strengthening of social security benefits for social classes that are vulnerable to the impact of COVID-19.
Turning now to the change in consumption expenditures by yearly income bracket, the middle rows of the table show consumption expenditures by income quintile rank of worker’s household yearly income in 2019 and 2020 and the coefficient of concentration of the same years. In worker’s household as a whole, average consumption expenditures declined significantly from 281,000 yen in 2019 to 262,000 yen in 2020. By income bracket, a decrease in consumption expenditures for all income brackets can be observed. The largest declines are seen in the expenditure items of clothing & footwear (down 17.1%) and culture & recreation (down 15.0%).
In particular, relatively large declines in expenditure are seen for the high-income bracket in quintiles IV-V, with the rate of change in consumption expenditures exceeding 7% negative. As a result, the coefficient of concentration, which indicates the disparity in consumption expenditures among income brackets, decreased by around 3.8% from 0.186 to 0.179. However, some expenditure items show a widening disparity. In the case of medical care, for example, expenditure by the low- and middle-income brackets for quintiles 1 to II decreased by 8.6% and the coefficient of concentration increased by around 9.1%.
Moving on to the trend of assets among income brackets, the bottom rows of the table show the net increase of financial assets (net increase in savings and insurance + net purchases of securities) and the coefficient of concentration based on each income quintile rank in worker’s household in 2019 and 2020. Looking at the net increase of financial assets and the change in net assets per household during one month in 2019 and 2020, the net increase of financial assets in 2020, when the COVID-19 pandemic had a major impact, was larger than in 2019. It must, however, be noted that this does not represent the total amount of financial assets.
By income bracket, on the other hand, the middle- and high-income brackets showed a higher rate of increase, with the coefficient of concentration rising by 4.0%. In other words, a tendency was observed for the inequality in worker’s household financial assets to widen prior to and after the COVID-19 pandemic. Future policy responses to the issue of inequality implemented by the public sector should pay attention to the trends in asset inequality prior to and after COVID-19. There is also a need to compile statistics that provide a comprehensive view of trends in income, expenditures, and assets for self-employed households.
According to the Family Income and Expenditure Survey by MIC, the average unemployment figure for the July-September period 2021 was 2.11 million, a decrease of 130,000 compared with the same period last year. However, the number of long-term unemployed, defined as those who have been unemployed for “one year or longer,” is 680,000, an increase of 180,000. The actual number of recipients of the basic allowance of employment insurance is 481,000, around a quarter of the total number of unemployed.
Reasons for not receiving employment insurance while unemployed include (1) not being eligible for employment insurance; (2) received employment insurance but the benefit period has ended; and (3) not having applied for employment insurance. To be eligible for employment insurance currently, scheduled working hours must be at least 20 hours per week and employment must be expected to continue for a minimum of 31 days. This means that some workers, such as contract workers, part-time workers, and temporary workers, are not covered by employment insurance.
The COVID-19 pandemic is expected to trigger a shift in many industries to a more capital-intensive structure that makes greater use of IT. Before debating how to increase employment flexibility, there is an urgent need to correct the current situation in which types of employment with a high degree of instability are excluded from the social insurance safety net.
Translated by The Japan Journal, Ltd. The article first appeared in the “Keizai kyoshitsu” column of The Nikkei newspaper on 16 November 2021 under the title, “Korona-ka no kakusa kakudai (II): Shotoku chukanso-kan de kotonaru eikyo (Widening Income Inequality During COVID-19 (II): Differing Impact Across Income Brackets).” The Nikkei, 16 November 2021. (Courtesy of the author)
Keywords
- Urakawa Kunio
- Faculty of Economics
- Kyushu University
- COVID-19
- income
- income inequality
- income disparity
- income redistribution
- special income
- household income
- income bracket
- worker’s household
- quintile rank
- Gini Coefficient
- expenditure
- assets
- unemployment
- employment safety nets
- employment insurance
- social insurance
- Family Income and Expenditure Survey
- Statistics Bureau
- Ministry of Internal Affairs and Communications