UPPER HOUSE ELECTION 2010: WHAT DOES IT MEAN FOR THE DPJ?
“I believe that this change of power was brought about by the voices of the public urging something should be done to fix Japanese politics of today. . . . In that sense, the victors in that summertime election were each Japanese citizen.” So declared Prime Minister Hatoyama Yukio in a policy speech to the National Diet last autumn. But in less than a year after “that summertime election,” large numbers of citizens lost the sense of being victors. The Democratic Party of Japan, which took power after scoring a major victory in last summer’s House of Representatives election, did dismally in this summer’s House of Councillors election. By comparison with the previous upper house election in 2007, the DPJ got 1.25 million fewer votes in the prefectural district races and 4.80 million fewer in the proportional-representation balloting, winning only 28 district seats and 16 proportional-representation seats, a total of just 44. The Liberal Democratic Party, which the DPJ threw out of power just last year, won the largest number of seats this time, 39 in the districts and 12 by proportional representation, a total of 51. And the DPJ-led government coalition lost its upper house majority; once again the Diet has become split between a lower house where the administration holds a majority and an upper house dominated by the opposition.
The DPJ’s defeat was attributable to multiple factors. These included such issues as the trouble over the proposed relocation of the US Marine Corps Futenma Air Station, problems relating to money and politics, and the consumption tax. And its difficulties were compounded by the nature of the electoral system for the upper house.
The DPJ’s support among voters was gradually eroded by various developments that made them critical, notably the disappointing performance of the Hatoyama administration and talk of hiking the consumption tax, which Prime Minister Kan Naoto (who succeeded Hatoyama when the latter stepped down in June) mentioned during the upper house election campaign. Even so, it managed to win more votes than the LDP–22.75 million to the LDP’s 19.49 million in the prefectural districts and 18.45 million to 14.07 million in the proportional-representation ballot. So why was the LDP able to win more seats? Its success was attributable to the distinctive electoral system for the upper house. The members are chosen through a mixture of proportional representation and voting by prefectural district, and there is variety in the number of seats per district; each of the 47 prefectures is an electoral district, with the number of seats contested in each election varying from one to five.[1. The House of Councillors has 242 members serving six-year terms, of whom 96 are chosen by proportional representation and the remainder are elected from electoral districts corresponding to the 47 prefectures. The number of seats per prefectural district ranges from 2 to 10 depending on their population. Half of the seats are up for election every three years. References to “single-seat” contests indicate prefectures with two upper house seats, of which just one is contested in each election.–Ed.]
In the single-seat district contests (in prefectural districts with relatively small populations) the LDP won 8.25 million votes and took 21 seats, while the DPJ, with 6.65 million votes, got only 8 seats. In other words, the LDP scored a considerably larger victory in terms of seats won than it did in terms of votes cast. In the multiple-seat district races (in more populous prefectures), by contrast, the difference in seats won was smaller than in the single-seat races: The DPJ, which won 16.09 million votes, got 20 seats, while the LDP, with only 11.24 million votes, still got 18 seats. So the LDP’s victory was made possible by the fact that the DPJ’s loss of votes in the single-seat contests had a magnified impact on the outcome.
The research team that I head at the University of Tokyo and the Asahi Shimbun together conducted opinion surveys targeting the same set of voters following last year’s lower house election and again following this year’s upper house election. Since the respondents were the same, it is possible to track changes in their opinions directly and in more detail than would otherwise be feasible. Table 1 compares the votes that respondents cast in the proportional-representation balloting in the two elections. We see that over 40% of those who voted for the DPJ last year picked a different party this year. What sort of people abandoned the DPJ?
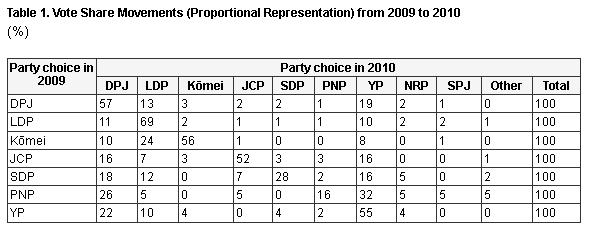
DPJ: Democratic Party of Japan
LDP: Liberal Democratic Party
Kōmei: New Kōmeitō
JCP: Japanese Communist Party
SDP: Social Democratic Party
PNP: People’s New Party
YP: Your Party
NRP: New Renaissance Party
SPJ: Sunrise Party of Japan
Disappointment with the DPJ
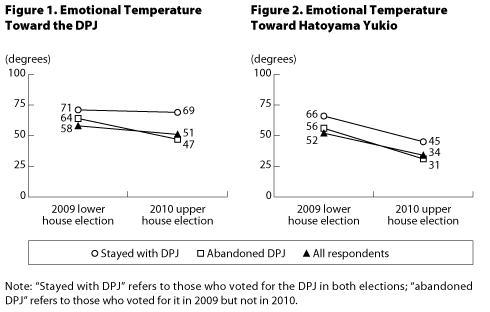
The clearest expression of voters’ disappointment with the DPJ administration that took power last year is the change in their “emotional temperature.” This is an indicator of people’s feelings toward political parties and individual politicians; it ranges from 0 to 100 degrees, with 50 indicating neutral sentiment, 0 indicating the strongest aversion, and 100 the strongest favorable sentiment.
Figures 1 and 2 show the respondents’ average emotional temperatures toward the DPJ and former Prime Minister Hatoyama Yukio just after the two elections. The declines are obvious in both graphs. In particular, sentiment toward Hatoyama dropped almost 20 degrees, showing how greatly disappointed people were in him. But we see a sharp contrast when we look separately at those who voted for the DPJ in both elections and those who abandoned it this year. Those who stayed with the DPJ showed a sharp drop in warmth toward Hatoyama, but their sentiment toward the DPJ remained almost unchanged. But those who abandoned the DPJ this year showed drops in warmth toward both Hatoyama and the party. In other words, those whose dissatisfaction was limited to Hatoyama and did not extend to the DPJ were unlikely to change their voting behavior in this year’s election. In that sense, the replacement of Hatoyama by Kan as prime minister and DPJ president in June may be said to have had some effect as an election tactic. Incidentally, respondents’ emotional temperature toward Kan as measured in this year’s survey was higher than that toward Hatoyama in the case of both those who stuck with the DPJ and those who abandoned it.
Disappointment with the DPJ administration can be seen not just in these indicators of emotional sentiment but also in respondents’ evaluations of the Hatoyama administration’s performance and of the DPJ’s capability to implement policies. Figure 3 shows the results of our survey this time concerning evaluations of the performance of the administration and of Hatoyama as an individual with respect to 17 items, ranging from policy issues and initiatives to political funding scandals. The overall ratings were negative for 10 of the 17, including items relating to alleged political funding irregularities and ones relating to the administration’s failure to reach goals or implement pledges set forth in the DPJ’s 2009 election manifesto. And even in cases where the administration did follow through on its manifesto pledges, voters turned their thumbs down on some measures that have come under criticism as indiscriminate largesse. Their positive ratings were directed mainly at moves toward reform of public administration and of the organs of government.
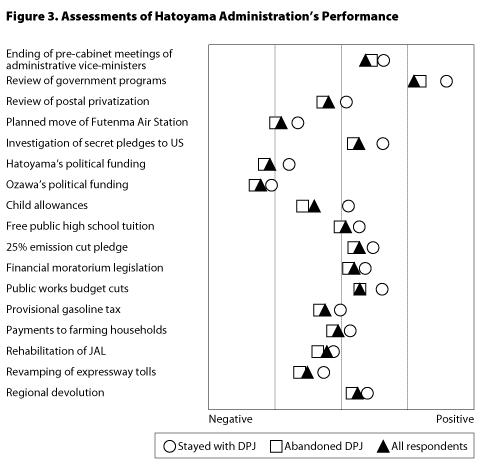
Overall, those who stayed with the DPJ in this year’s election offered more favorable assessments of the Hatoyama administration’s performance than did those who abandoned the party this time. This was true even with respect to items relating mainly to Hatoyama as an individual, such as the doubts about his political funds and his messy handling of the proposed relocation of the US Marine Corps Futenma Air Station in Okinawa. On the Futenma issue Hatoyama is seen as having done himself in by declaring he wanted to move the facility “at least” outside of Okinawa Prefecture. His failure to deliver on this, combined with the funding issue, turned voters off, and even though Hatoyama stepped down in advance of this year’s election, he cannot escape some of the blame for the DPJ’s defeat.
The Impact of Kan’s Remarks about the Consumption Tax
On June 17, at a press conference held to announce the DPJ’s new manifesto for the upper house election, Prime Minister Kan suddenly mentioned that he wanted to see a proposal for reform of the consumption tax by the end of the current fiscal year (March 2011). He subsequently suggested that any increased burden on low-income households resulting from a hike in the tax could be offset by a tax refund, but then he made several inconsistent statements about the income level of those who would be eligible for refunds. This made him the target of criticism from both inside and outside the DPJ. After the election Kan and others in the party acknowledged that his remarks about the consumption tax contributed to the DPJ’s defeat because they struck the public as abrupt. The extent of the impact is open to debate, but it is clear even from the results of our survey that the prime minister’s remarks hurt his party in the election.
The first point to note in this connection is that the voters were late in making up their minds this time. Only 38% had already decided which party to vote for as of June 2, when Hatoyama announced he was stepping down. In other words, over 60% made their final decisions after Kan (effectively) took over. This suggests that their voting behavior in this year’s election was affected by the formation and performance of the new Kan administration.
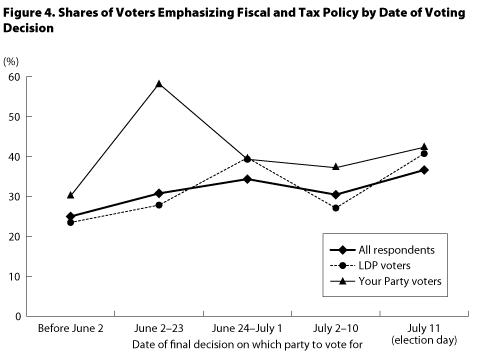
Furthermore, we can be certain that Kan’s remarks relating to the consumption tax had an impact on voting behavior. Some 30% of those surveyed declared that policies regarding “government finances and taxes” were of “utmost importance” for them in this year’s election, a higher share than for other policy issues. Furthermore, the perceived importance of this issue among voters increased after Kan replaced Hatoyama at the helm. Figure 4 divides the respondents into five groups according to the timing of their final decision on which party to vote for and shows the shares of those who cited fiscal and tax affairs as being of utmost importance among each of these groups. The share was 25% for all respondents in the group who made up their minds before Hatoyama’s resignation. But the percentage was higher among those who decided later, reaching 37% in the case of those who did not make their final decisions until election day. These results strongly suggest that many voters had their attention drawn to this issue by Kan’s remarks about the consumption tax and that they made their decisions with it in mind.
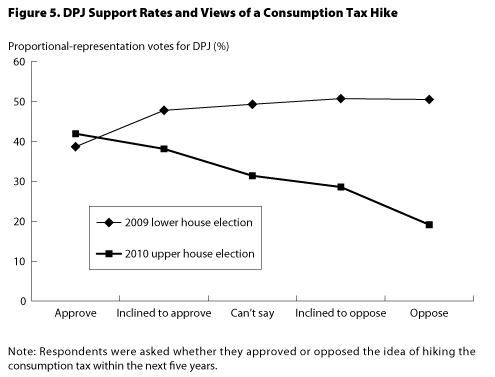
To be sure, the LDP, which is in favor of raising the consumption tax rate, came out of the election with more seats than before, so one might judge that voters did not reject the tax hike line. However, the survey data seem to indicate that significant numbers of voters took a dim view of Kan’s bringing this matter up and that the DPJ lost votes as a result. Figure 5 shows the DPJ’s vote shares among voters broken down into five groups according to their views toward a consumption tax hike. (Here and below in this section, the figures refer to the results of the proportional-representation voting.) Last year, the more opposed people were to a consumption tax hike, the more likely they were to vote for the DPJ, but this year the opposite tendency prevailed.
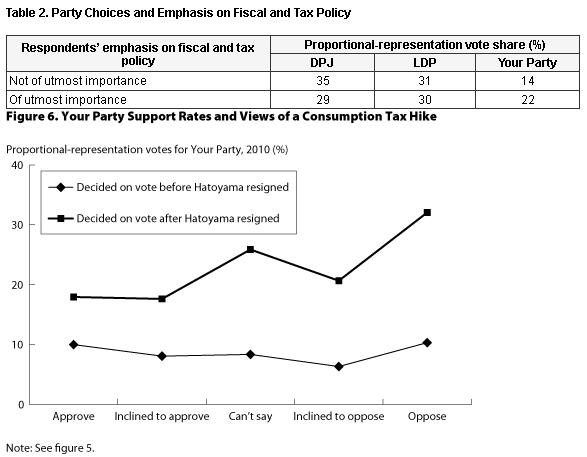
Among those who abandoned the DPJ this year, some opted for Your Party, which came out explicitly against a consumption tax hike. Table 2 divides respondents into two groups, those who identified fiscal and tax policies as of utmost importance and those who did not, presenting the shares of each group’s votes for the DPJ, the LDP, and Your Party. The LDP’s vote shares were almost the same in both groups, but Your Party’s share was 8 percentage points higher among those who considered fiscal and tax policies very important than among those who did not. And if we return to figure 4, we can see that the share of voters stressing this issue was especially high among those who decided to vote for Your Party in the period from June 2 to 23, which is when Kan made his remarks about the consumption tax. Among those who voted for the LDP, by contrast, we do not see that sort of sharp increase. Figure 6 looks at those who voted for Your Party according to whether they decided to do so before or after Hatoyama announced his resignation and examines the relationship between views about hiking the consumption tax and Your Party’s vote shares. In the group that made up their minds before Hatoyama stepped down, we find almost no relationship between support for Your Party and views about the consumption tax. But in the group that made up their minds after Hatoyama stepped down, we see a marked tendency for opponents of a consumption tax hike to be more likely to opt for Your Party. [1. Though the graph does not show it, those who voted for the LDP did not exhibit such a tendency.]
The above analysis suggests that voters leery of a consumption tax hike were irritated by Kan’s remarks on the topic, which encouraged them to vote for Your Party. It is also conceivable that even among voters not opposed to hiking the tax, some felt that Kan was untrustworthy because he raised this topic so abruptly or were turned off by the inconsistency of his statements and that this hurt the DPJ at the polls.
What is more important to note, however, is that the number of people who approve the idea of a consumption tax hike has increased. If we take the sum of the percentages of those who declare outright approval and those who said they were inclined to approve, we find that the share of those with affirmative views has risen 12 points to 46%, topping the share of those opposed (30%). And among those who switched to approval in this year’s survey, the share who voted for the DPJ was higher than among those who approved both last year and this (41% to 38%). It is possible that these results were affected by the fiscal policy of the Hatoyama administration, which had trouble finding tax revenues to pay for the policies pledged in the DPJ manifesto, and by Kan’s remarks about the consumption tax. This implies that the election results might have been different had the DPJ administration devoted more time and attention to explaining the fiscal and tax issues to the public.
The “Magic” of the Electoral System
In this year’s upper house election the LDP won 21 of the 29 seats in the single-seat prefectural races; this big win is what made it come out ahead of the DPJ in the total number of seats won. If we look at the vote shares for these two parties both last year and this year in the prefectural district voting broken down by the size of the prefecture, distinguishing between the 29 single-seat prefectural contests and the 18 multiple-seat races, we find that in the multiple-seat races (more populous prefectures) the DPJ outperformed the LDP by a margin of more than 10 points both times: 50% to 37% in last year’s lower house election and 39% to 28% in this year’s upper house election. In the single-seat races (less populous prefectures), by contrast, the LDP won more votes than the DPJ both times, and the margin of its win was greater this year than last: 43% to 41% last year and 47% to 38% this year.
If we look at the voting records from our survey data, we see that among those who voted for the DPJ in the proportional-representation balloting last year but switched to another party this year, the shares of the parties they picked differed somewhat depending on the size of their prefecture: In the more populous prefectures (multiple-seat races) 20% switched to Your Party and 13% to the LDP, while in the less populous prefectures (single-seat races) the figure was 15% for both–in other words, a somewhat stronger showing for the LDP. Also, among those who voted for the LDP in last year’s election, 76% of those in the less populous prefectures voted for it again this year, against 66% of those in the more populous ones. Here we see the LDP’s strong performance in the less populous prefectures.
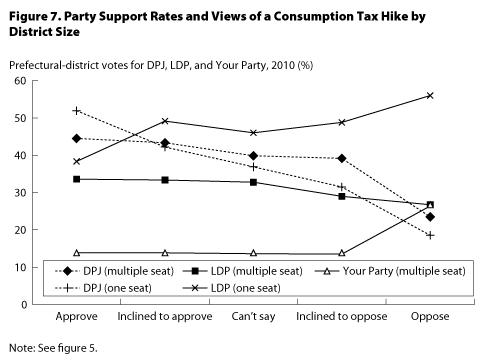
What led to the LDP’s big advantage in the single-seat prefectural races? In both the less and more populous prefectures fiscal and tax policy was the item most frequently cited as being of utmost importance, and we find no significant difference between the two groups of prefectures in terms of shares approving and opposing a consumption tax hike either. If, however, we look at the vote shares of the LDP and the DPJ in the two groups of prefectures distinguishing between those approving a hike and those opposed, we find that support for the LDP in the less populous prefectures tended to increase in tandem with opposition to a hike (figure 7). In the more populous prefectures, by contrast, no such correlation is apparent. There, many of those strongly opposed to a higher consumption tax gave their votes to Your Party, and the DPJ, LDP, and Your Party all ended up with similar vote shares.
In most of the multiple-seat prefectural contests there was a strong candidate (such as one from Your Party) opposed to raising the consumption tax, and many voters opposing a hike chose this candidate. But in almost all the single-seat prefectural contests, the only candidates with a realistic chance of winning were the ones from the DPJ and the LDP–both of which had indicated approval of a rate hike. It seems likely to us that faced with this set of alternatives, many voters opposed to a higher consumption tax selected the non-DPJ candidate (in other words, the LDP candidate) based on the idea that if the DPJ-led ruling coalition won in the election, it would be sure to implement a hike, but if it were defeated, it might be forced to reconsider its position. [1. In the multiple-seat prefectural district races, 60% of those who picked Your Party in the proportional-representation voting also voted for Your Party’s candidate in the district race, but in the single-seat prefectural races the corresponding figure was only 17%. ] Since the LDP had been just about neck and neck with the DPJ in these districts, the addition of these anti-DPJ votes enabled it to come out ahead of the DPJ in the vote count. And in the single-seat races, the candidate who comes out ahead by even a single vote is the lone winner. It was through this “magic” of the electoral system that the LDP was able to garner many more seats than the DPJ.
Prospects for the “Twisted” Diet
As a result of its defeat in the upper house election, the DPJ administration now must deal with the phenomenon of nejire, or “twisting,” in the Diet, meaning that control of the two chambers is split between the ruling coalition (with a majority in the lower house) and the opposition (with a majority in the upper house). The LDP-led ruling coalition faced a similar situation from 2007 through 2009, but it had a super-majority of two-thirds in the lower house, which allowed it to enact legislation even without upper house approval by voting on it a second time. The current administration does not have that sort of lower house margin. And in view of the large number of DPJ seats that were not in contest this year but that will be up for grabs in the next upper house election three years from now (62), it seems unlikely that the party will be able to secure an outright majority in the upper house in 2013 either. In other words, unless the DPJ falls from power or there is a realignment of the existing parties, the DPJ will need to work in alliance with another party or parties for the next six years.
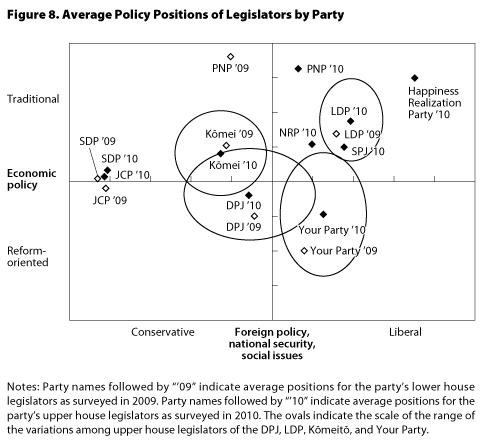
The first party that comes to mind as a potential alliance partner is the New Kōmeitō. This party came out of the election with fewer seats in the upper house than before, but it holds a pivotal position, since combining its 19 members with the DPJ’s 106 is enough to form a majority in the chamber. Figure 8 shows the average policy positions of the principal parties as surveyed in 2009 (lower house) and 2010 (upper house).[1. We used the statistical technique of factor analysis, looking at the views of lawmakers based on their answers on the same 16 items in 2009 and 2010, from which we extracted the two factors used as axes in the graph.] The 2010 position of the DPJ is close to the center of this diagram, and the party nearest to it is the Kōmeitō. This might seem to indicate that it would be easy for the two parties to enter into a cooperative relationship.
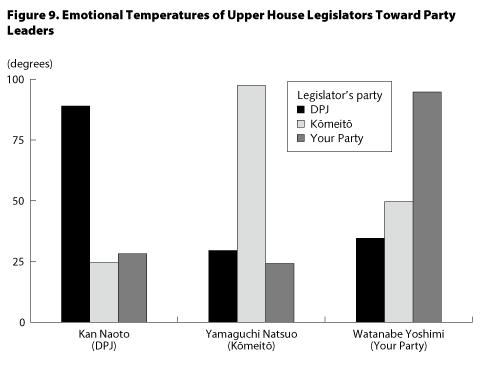
In reality, however, this would be difficult to accomplish. Figure 9 presents the emotional temperatures of upper house legislators from the DPJ, Kōmeitō, and Your Party toward the leaders of these three parties. Here we see that the lawmakers of both the DPJ and the Kōmeitō are cool toward each other’s leaders, with emotional temperatures of only 20-30 degrees. It would not be easy for the Kōmeitō to improve its relations with Prime Minister Kan and Chief Cabinet Secretary Sengoku Yoshito, his right-hand man, neither of whom have been friendly toward their party up to now. And within the DPJ there is a substantial number of legislators who have an allergic reaction to the Kōmeitō. Even if the politicians of the two parties were able to work out a reconciliation, they could well face a problem with their supporters. As figure 10 indicates, DPJ voters in particular are very cool toward the Kōmeitō. Furthermore, up to now the Kōmeitō, which for many years was the LDP’s partner in the ruling coalition, has supported the LDP candidate in many electoral districts; an abrupt shift of course is unlikely.[1. According to Asahi Shimbun exit polling, 60% of Kōmeitō supporters voted for the LDP candidate in single-seat prefectural races. (Asahi Shimbun, July 12, 2010)]
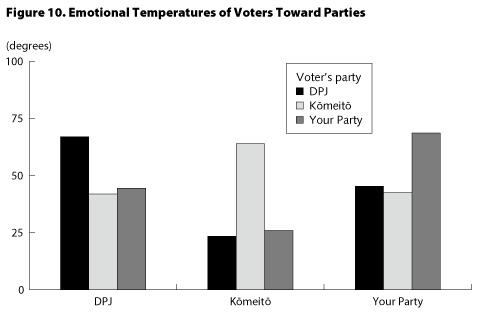
According to figure 10, DPJ and Your Party voters are not that averse to each other’s parties. But because the DPJ lost so many seats in the upper house this year, adding the Your Party members to those of the present ruling coalition (the DPJ and the People’s New Party) is not enough to form a majority. And figure 8 suggests that Your Party has been increasing its distance from the DPJ in terms of policy positions, on top of which the range of views among its members is surprisingly broad. Watanabe Yoshimi, Your Party’s leader, has rejected the idea of a coalition with the DPJ, and the personal relations between the politicians of the two parties are not warm. So the hurdles to an alliance are considerable.
This suggests that at least for the near future the DPJ’s only option is to form “partial coalitions” by looking for partners on an issue-by-issue basis and striving to come up with compromise positions to win their votes for legislation on particular policies. It is possible that building a track record of working together on particular matters will serve as the basis for the building of a more ongoing framework of party-to-party cooperation.
The Winds of Autumn
When we reported the results of our survey of last year’s lower house election (in Sekai, December 2009), we noted that despite the ouster of the LDP from power by the DPJ, the former still came out ahead of the latter in terms of voters’ long-term preferences (which party they said they were inclined to support over the long term) by a margin of 41% to 25%. We expected this distribution to change as the DPJ continued to hold power, but in our survey this year we found the LDP to still hold a considerable lead: 35% to 25% for the DPJ.
But when asked whether the change of government was a good thing, 57% replied affirmatively (including those who said yes and those who said they were inclined toward yes). So at this point a majority of people do not regret having put the DPJ into power. Up to now, even though the LDP has led in terms of long-term preferences, the DPJ has been able to win more votes. If, however, the DPJ administration, struggling to cope with the challenges of severely strained public finances and a split Diet, fails to achieve results on the policy front, the situation may change, and the DPJ may find itself facing harsh autumnal winds.
Even in this case, however, the LDP cannot be assured of a return to power. This year the LDP managed to win the votes of only 66% of those who identified themselves as its long-term supporters. The party has failed to make a satisfactory recovery from its poor retention rate in last year’s election. Also, the emotional temperature of these supporters toward the party is a tepid 62 degrees, lower than the 69-degree temperature that the DPJ’s long-term supporters express toward their party. On top of that, of the swing voters who picked the LDP in the 2005 lower house election (called by Prime Minister Koizumi Jun’ichirō when the Diet rejected his postal privatization plan) and who switched to the DPJ in last year’s election, less than a quarter swung back to the LDP this year. Most of them either stayed with the DPJ or voted for Your Party. So the winds blowing on the LDP carry not just optimistic hopes of victory but also elements of pity.
Translated from “2010 nen Sangiin senkyo: Minshu seiken ni fuku akikaze?” Sekai, October 2010, pp. 58-67, © 2010 by Taniguchi Masaki, Sakaiya Shirō, Ōkawa Chihiro, Uenohara Hideaki; slightly abridged. Translated and published with permission of the authors c/o Iwanami Shoten, Publishers. [October 2010]
Related posts:
 HOW SHOULD JAPAN DEAL WITH A RICH, STRONG CHINA?
THE STRONG PRIME MINISTER: CAN A NEW KOIZUMI EMERGE?
KAN'S DOMESTIC HURDLES
HOW SHOULD JAPAN DEAL WITH A RICH, STRONG CHINA?
THE STRONG PRIME MINISTER: CAN A NEW KOIZUMI EMERGE?
KAN'S DOMESTIC HURDLES
 Interpreting the Upper House Elections: Please don’t squander your political capital, Prime Minister! ―Putting growth strategies and fiscal health ahead of constitutional reform
 Interpreting the Upper House Elections: Two concerns about maintaining the status quo ― Sustaining social security and Japan’s policy towards China